
A model can classify historical outcomes reasonably well and still fail to produce a viable real-world process. Prediction metrics describe how well a model matches labels. Profitability metrics describe the results of a defined decision and execution process. They are related, but they are not interchangeable.
This distinction is essential when a research label is based on a price reaching a future peak. The maximum observed price may be useful as a classification target, but it is not the same as a return that could reliably have been captured.
Define the decision process first
To measure realised performance, specify when a decision is made, what information is available at that time, how an entry is represented, when and how an exit occurs, and what costs apply. Include fees, slippage, liquidity constraints, failed transactions and any other material execution assumptions.
Do not let the model use information that arrives after the decision timestamp. Do not assume a trade could be entered at a candle's low or exited at its high unless the data and execution model support that assumption. The backtest must represent an implementable sequence, not an idealised path through the price chart.
Expectancy: average outcome per decision
Expectancy is the average net outcome over a set of decisions. In a simplified fixed-win/fixed-loss setting, it can be written as:
where p_w is the fraction of winning outcomes, W is the average net win, p_l is the fraction of losing outcomes and L is the average net loss expressed as a positive amount.
For a general set of trade outcomes, calculate the mean of the net returns after all defined costs. Expectancy depends on the exit rules and the distribution of returns, not just the model's positive-label rate.
A high classification precision does not guarantee positive expectancy. A system might identify many small gains and a few large losses. Another might have lower precision but a favourable payoff distribution. The full outcome distribution matters.
Sharpe ratio: return relative to variability
The Sharpe ratio compares average excess return with the variability of returns over a specified period:
where R is the return series and R_f is the risk-free return over the matching interval. In practice, analysts often use a simplified formula, but they must state the return frequency, annualisation method and assumptions.
A Sharpe ratio can be misleading if returns are serially correlated, samples are small, costs are omitted or the backtest uses unrealistic execution assumptions. Annualising a short and noisy sample can create an impressive-looking number that does not have stable meaning.
Drawdown: how far the process falls from a peak
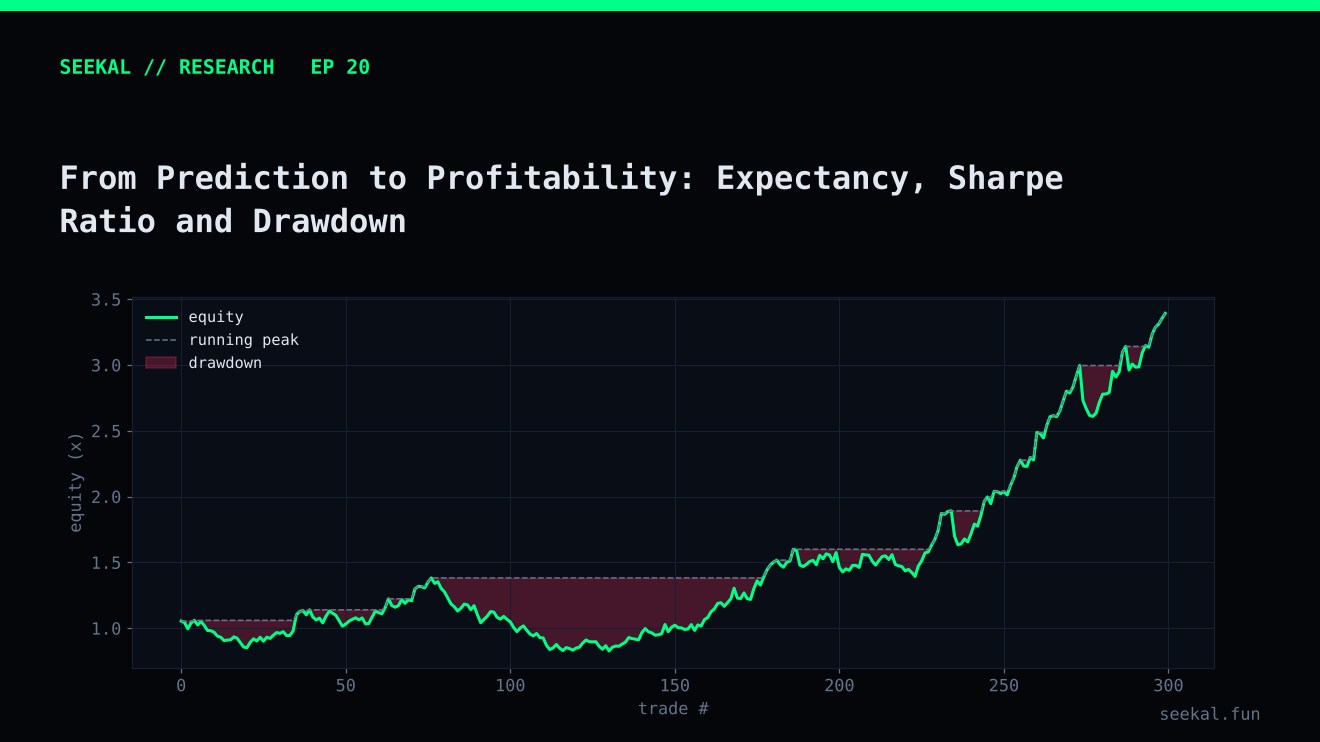
Drawdown measures the decline from a previous equity high to a subsequent low. Maximum drawdown is the largest such decline over the period. It captures a different aspect of risk from volatility: two systems can have similar average returns and volatility but different paths of losses.
Recovery time also matters. A system that experiences a deep drawdown may take a long time to return to its previous peak. Report the depth and duration, not only the maximum percentage.
Connect prediction to outcomes without confusing them
A robust research process evaluates the model in layers:
- Classification: precision, recall, ROC-AUC, PR-AUC and calibration against the research label.
- Selection: how many candidates the full model pipeline selects, and how those candidates are distributed across time.
- Execution simulation: whether entries and exits can be represented realistically with available data.
- Net outcomes: expectancy, return distribution, fees, slippage and liquidity constraints.
- Risk: volatility, drawdown, tail losses, concentration and sensitivity to market periods.
Each layer depends on the previous one, but success at one layer does not prove success at the next.
Avoid overclaiming from a peak-price label
In this project, GOOD meant that the maximum observed price within a fixed look-ahead window reached a set multiple of the entry price. It is a clearly defined research label. It does not specify an exit price, the time available to react, or whether a participant could transact at the peak.
Therefore, precision against this label is a measure of classification performance, not profitability. To make a claim about realised returns, the research needs an explicit execution simulation and costs that reflect the setting.
Stress-test the assumptions behind the backtest
Run sensitivity checks for fees, slippage, delayed entries, partial fills, liquidity limits and missed exits. Show how results change when assumptions become less favourable. Separate gross from net outcomes and report the number of simulated decisions. Avoid treating a return series with overlapping positions as independent observations. A backtest is a model of an execution process; its credibility depends on how transparently those assumptions are specified and challenged.
The practical lesson
Prediction is not profitability. Expectancy measures average net outcomes, Sharpe relates excess returns to variability, and drawdown describes losses from prior peaks. Use them only after defining a credible decision and execution process. The most convincing model report is one that separates what was predicted, what could be executed and what was actually earned in the simulation.