
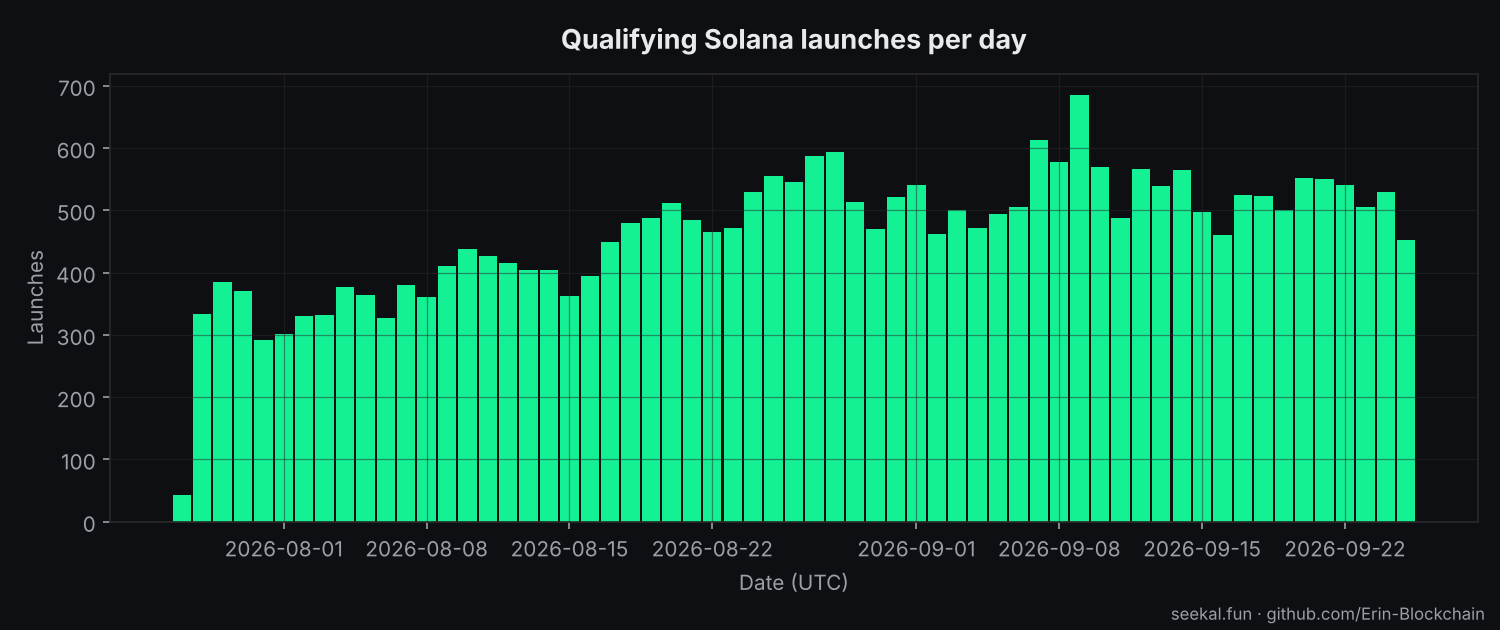
I spent two months collecting every Solana pump.fun launch that got a real first 15 minutes of trading: at least 25 trades and about $15,000 market cap by the quarter-hour mark. That is 28,327 launches between 2026-07-27 and 2026-09-25, with a 5-hour peak-price label on each one. The dataset and the notebook that builds the charts are public under CC BY 4.0: see the links at the bottom.
Here is what the numbers say.
1. The 2x line is where it gets interesting
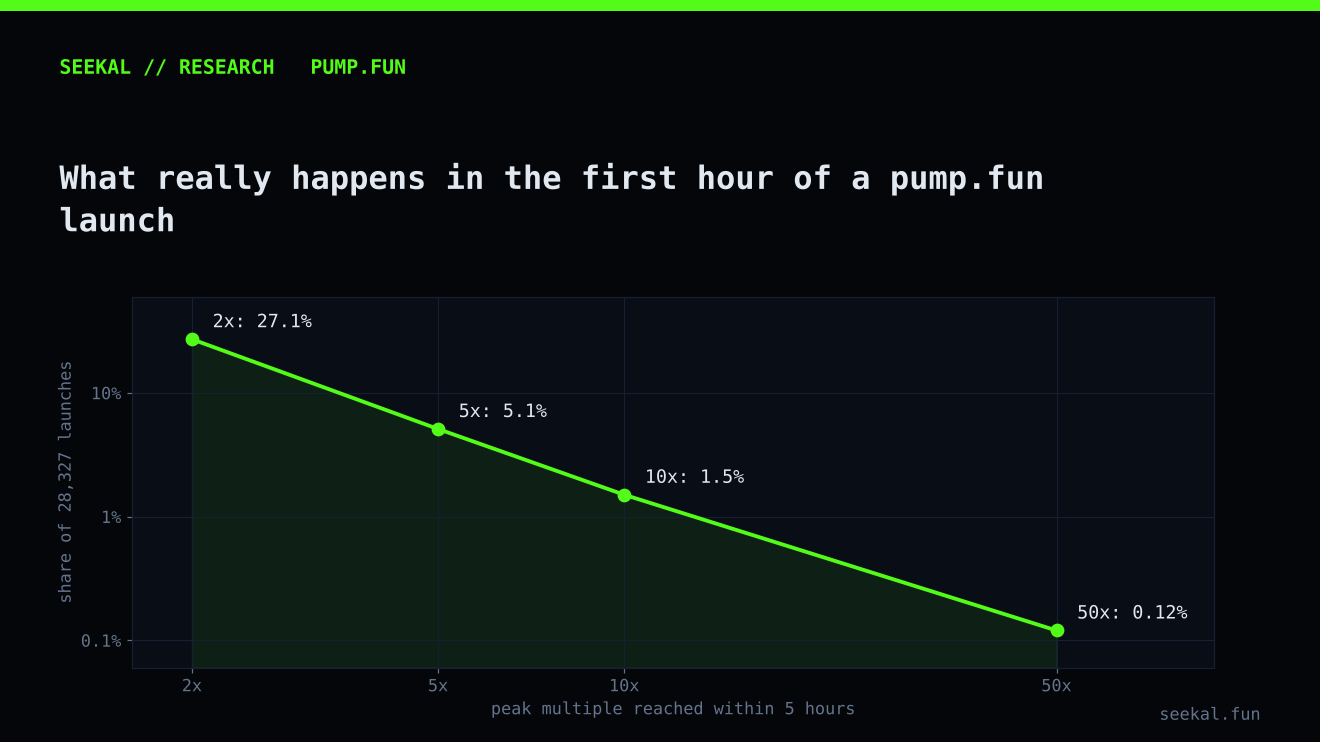
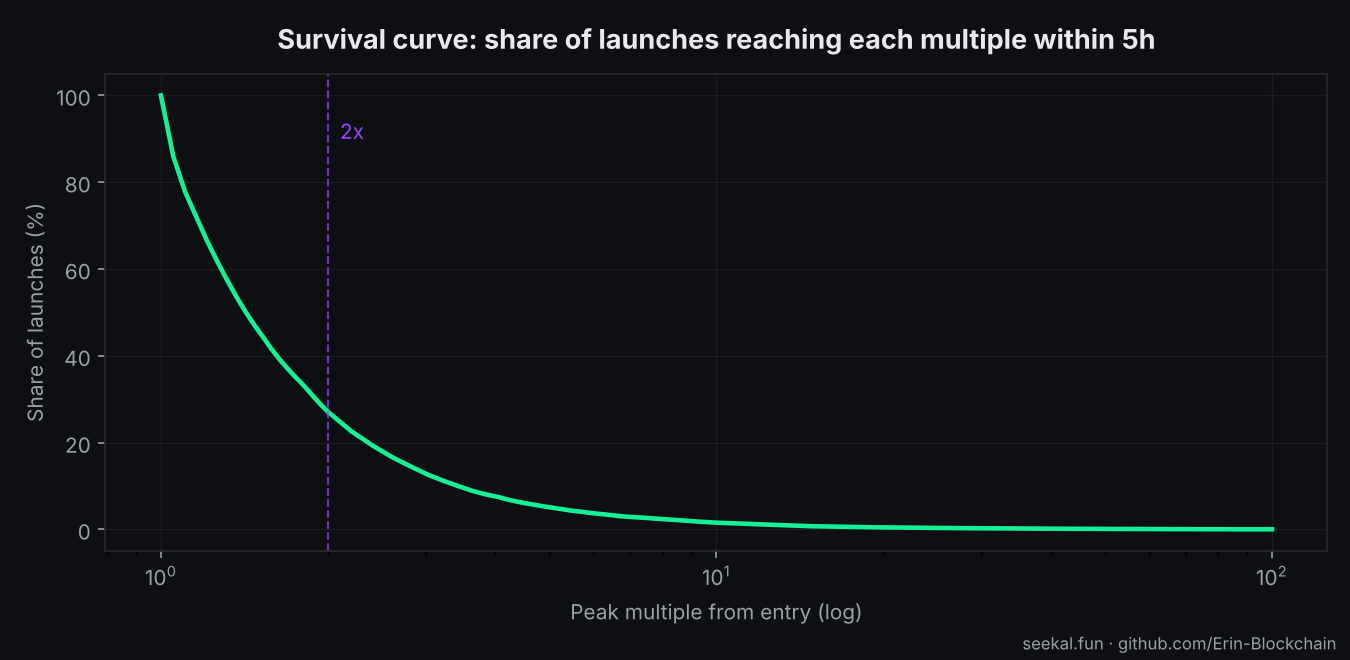
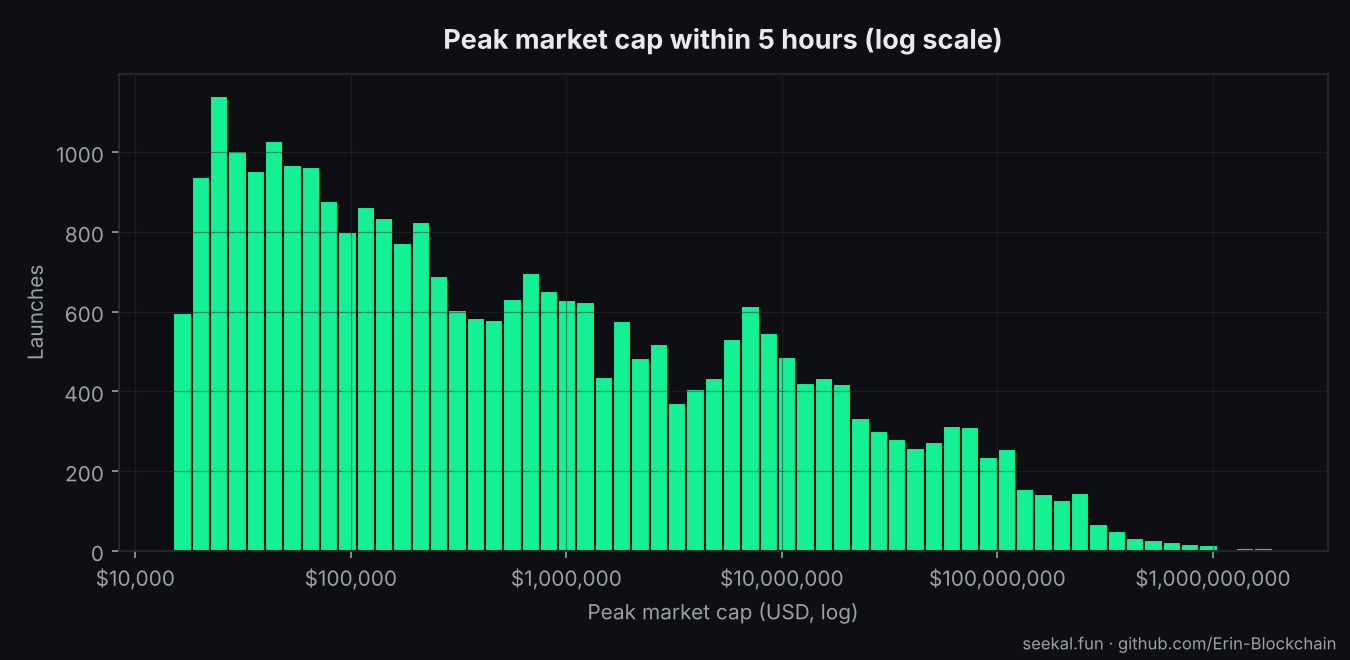
27.1% of qualifying launches reached at least a 2x peak within 5 hours of entry. 5.1% reached 5x, 1.5% reached 10x, and 0.12% reached 50x. The distribution looks like a classic power law: most launches barely move after the first fifteen minutes, a thin tail runs very hard. If you draw the survival curve on a log x-axis, every doubling of the target cuts the survivor share by a roughly constant factor.
That shape has one practical consequence: the median return is not where the money is. The thin tail is.
2. Volume is heavily front-loaded, and buy pressure drops with age
Launches do most of their first-15-minute work in the opening five minutes: median 5-minute volume is about $56,822 and median 15-minute volume is only $104,191. That matches what anyone watching pump.fun sees live, but the ratio is remarkably stable across the whole sample.
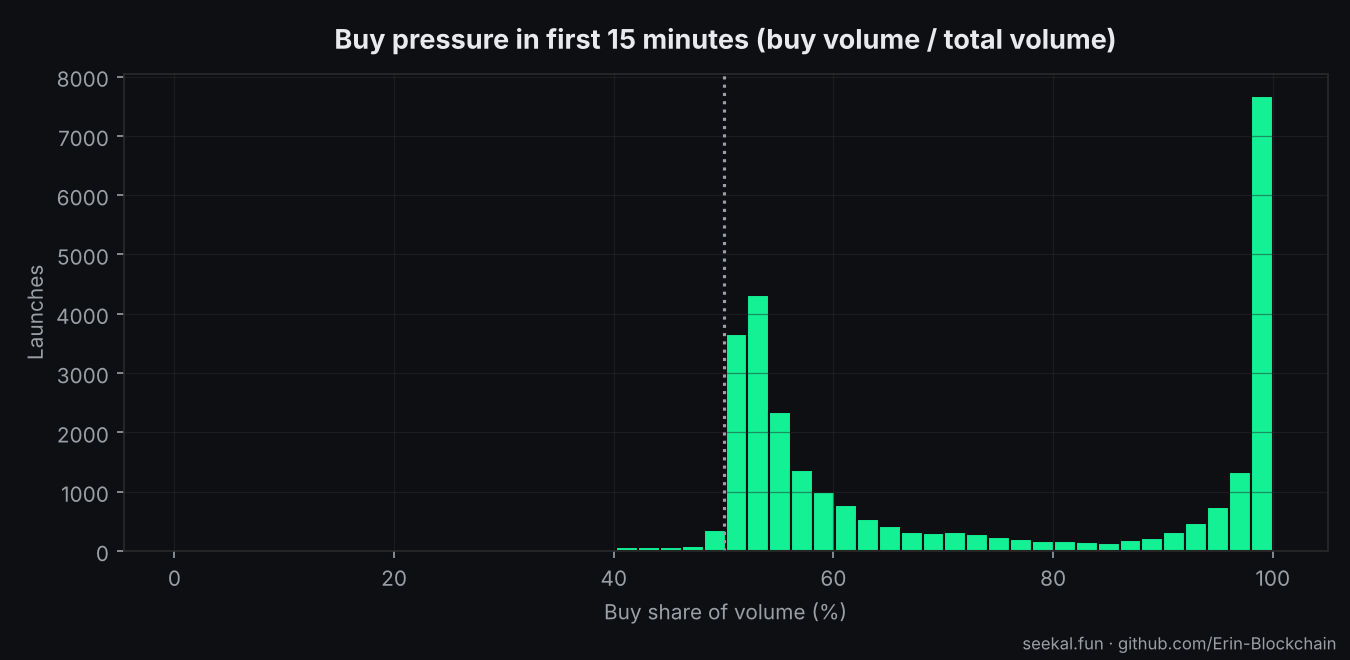
The buy share of volume starts high and drifts. Median buy share in the first 15 minutes is 62%, with a thick tail above 80% (the obvious "pumped" launches) and a smaller tail below 20% (dumped).
3. Trade count and peak multiple are related, but not strongly
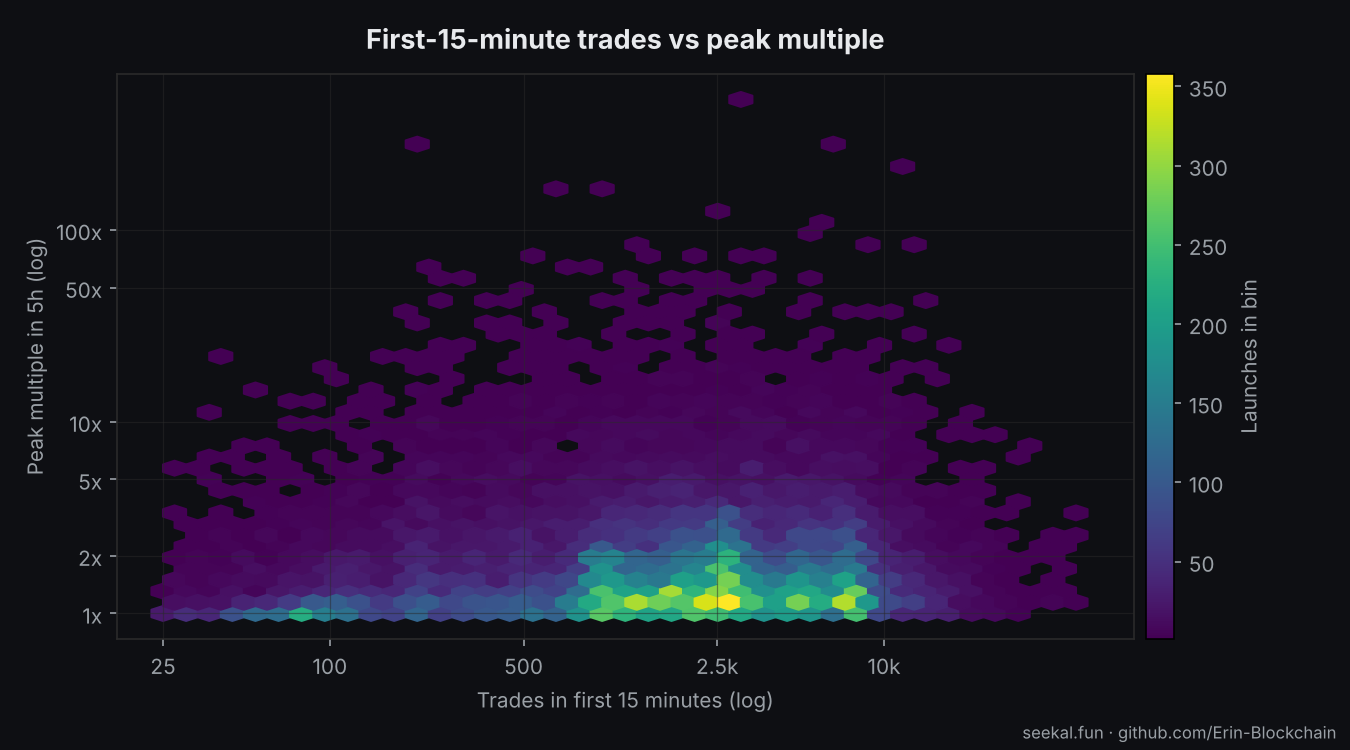
Hex-binning trades in the first 15 minutes against peak multiple in 5 hours shows a wide cloud. There IS a positive slope: launches that traded thousands of times early are over-represented in the 10x+ bucket. But the cloud is wide enough that trade count alone is a weak signal. Most 10x+ launches are not in the top decile of early trades, and plenty of high-trade launches did nothing.
4. Launch timing follows the market, not the calendar
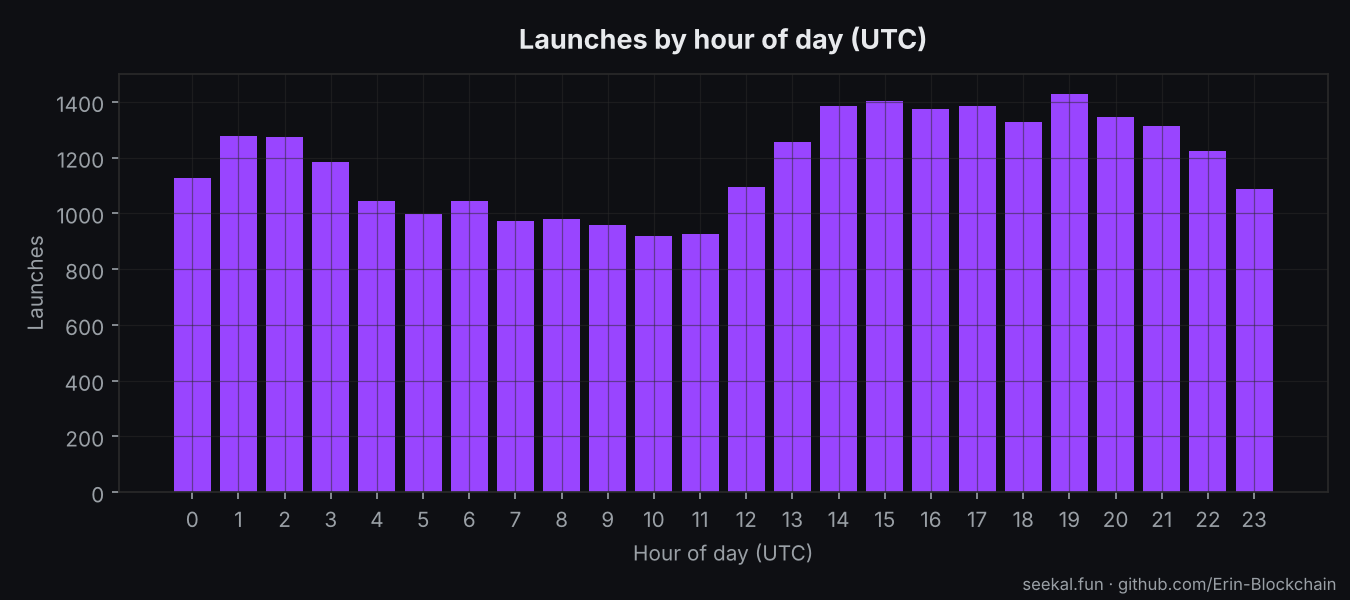
Launches are roughly evenly distributed across UTC hours, with a visible sag during Asian late-night and a bump around the US open. Day-of-week is flat. If you picked a random hour to go hunting, the hours around 14:00 to 20:00 UTC gave you the most candidates to look at.
5. "Peak within 5 hours" is a short game
The vast majority of 5-hour peak prices land in the first hour after entry. Holding past that point rarely added to the peak: it mostly fed drawdown. The 5-hour window is enough to capture the up-leg for almost every launch that was going to move.
What this is useful for
This is a public dataset of outcomes, not a strategy. The use cases I had in mind:
- Base rates for pump.fun launches above the gate, so anyone building a model has a baseline.
- Hour-of-day effects for people trying to time publishing or trading.
- Feature engineering: buy/sell imbalance, acceleration between the 5-minute and 15-minute windows, early-trade concentration.
- Holding-period studies: how much of the 5-hour peak is captured by shorter holds.
Limitations
- 1-minute granularity: intra-minute spikes are not resolved.
- Public pump.fun launchpad only.
- The gate (25 trades, ~$15k mcap by +15:00) is a filter, so numbers describe launches that already had a first 15 minutes, not every mint.
- The label uses 1-minute bar highs, so wicks count.
Get the data
- Dataset and notebook on GitHub: github.com/Erin-Blockchain/solana-launches-public
- Dataset on Kaggle: kaggle.com/erinfolamiyusuf
- Dataset on Hugging Face: huggingface.co/seekal
- My other work: seekal.fun
If you build something with this, tell me on X or open an issue. I will update the dataset periodically.
License: CC BY 4.0. Attribute to Erin, seekal.fun.