
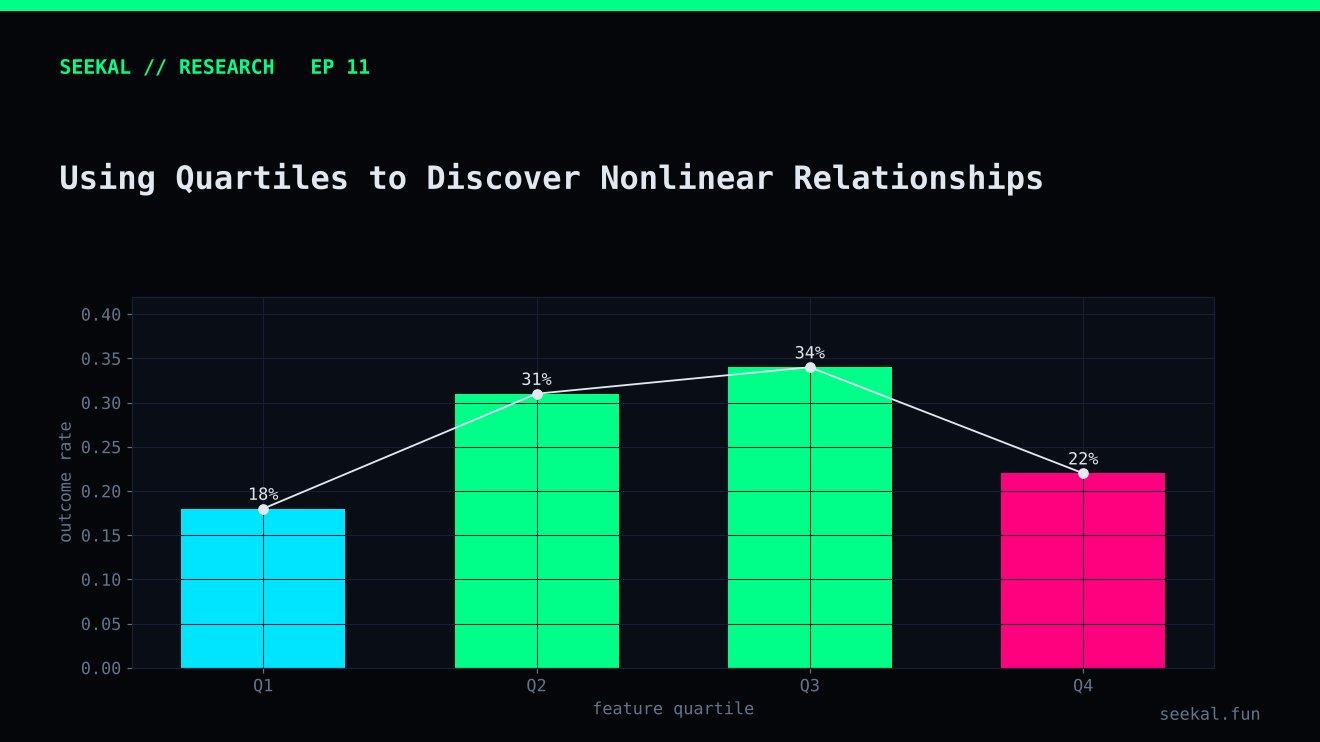
A feature does not always have a simple relationship with an outcome. More volume may be associated with better outcomes up to a point, after which the relationship flattens. A buyer-count feature may show its strongest positive rate in the middle of its range rather than at the top. A linear correlation can hide these shapes.
Quartile analysis is a simple exploratory tool for detecting possible nonlinear relationships. It is useful because it makes the data easier to inspect without assuming that every relationship is a straight line.
What a quartile does
Sort observations by a feature and divide them into four groups containing roughly equal numbers of rows. The first quartile contains the lowest values, while the fourth contains the highest. Then calculate the positive-label rate and the number of observations in each group.
For example, if the GOOD rate rises from Q1 to Q4, the feature may have a positive monotonic relationship with the label. If it rises from Q1 to Q3 and then falls in Q4, the relationship may be nonlinear. If the rates are similar across the four groups, the feature may have little standalone association—or the effect may depend on another variable.
The word “may” is important. Quartiles describe patterns in a sample. They do not prove causality or guarantee that the pattern will repeat.
A practical example
Suppose we examine unique buyer count. The GOOD rate might be 20% in Q1, 27% in Q2, 33% in Q3 and 28% in Q4. A simple linear interpretation—more buyers is always better—would miss the fact that the highest bucket has a lower rate than the third.
Several explanations are possible. The top bucket may contain a different mix of launches, the measure may be noisy, or the relationship may interact with liquidity or concentration. It may also be a random fluctuation. The table alone cannot decide.
In the BSC project, exploratory quartile tables for growth and quality features showed some non-monotonic patterns. For example, middle buckets were sometimes more favourable than the highest bucket. The exact rates changed between analysis runs when the quartile construction changed. That is a methodological warning: results from different bucketing procedures should not be combined as if they were one consistent experiment.
Build quartiles carefully
There are two common ways to create buckets. Equal-frequency quantiles aim to put roughly the same number of observations in each group. Fixed-width bins divide the numerical range into equal intervals. They answer different questions.
With repeated values, quantile boundaries may produce groups of different sizes or duplicate cut points. Rank-based bucketing can force more equal counts, but it can split identical feature values between adjacent groups. Document the method and the boundary values.
Always show sample counts beside the GOOD rate. A quartile with 500 observations provides a different level of evidence from a bucket with 20. If you examine quartiles separately by label or inside a small candidate set, the groups may become too small to interpret.
Avoid turning a chart into a rule
A quartile analysis can inspire a feature transformation or interaction. It should not be used to select a threshold and then report the same data as independent validation. If Q3 appears best, test the hypothesis on later data. Consider a spline, monotonic constraint, tree split or carefully defined interaction, depending on the model and the research objective.
Repeat the analysis across chronological periods. A relationship that appears only in one period may reflect regime-specific behaviour. Keep the feature definition and quantile procedure stable so the comparisons remain meaningful.
Repeat the bucket analysis by time period
A useful robustness check is to calculate the same quartile table separately across chronological blocks. Use boundaries estimated from the training period when the goal is a prospective evaluation, or clearly label the table as descriptive when boundaries are calculated on the complete sample. If the best-performing quartile changes from period to period, that may indicate regime sensitivity or sample noise. Report those differences rather than selecting only the period with the cleanest pattern.
The practical lesson
Quartiles are a lens, not a verdict. Use them to spot plateaus, reversals and possible thresholds; report counts and boundaries; and check whether the pattern survives across time. The best quartile is not automatically a trading rule, and a curve in one sample is not proof of a stable relationship.