
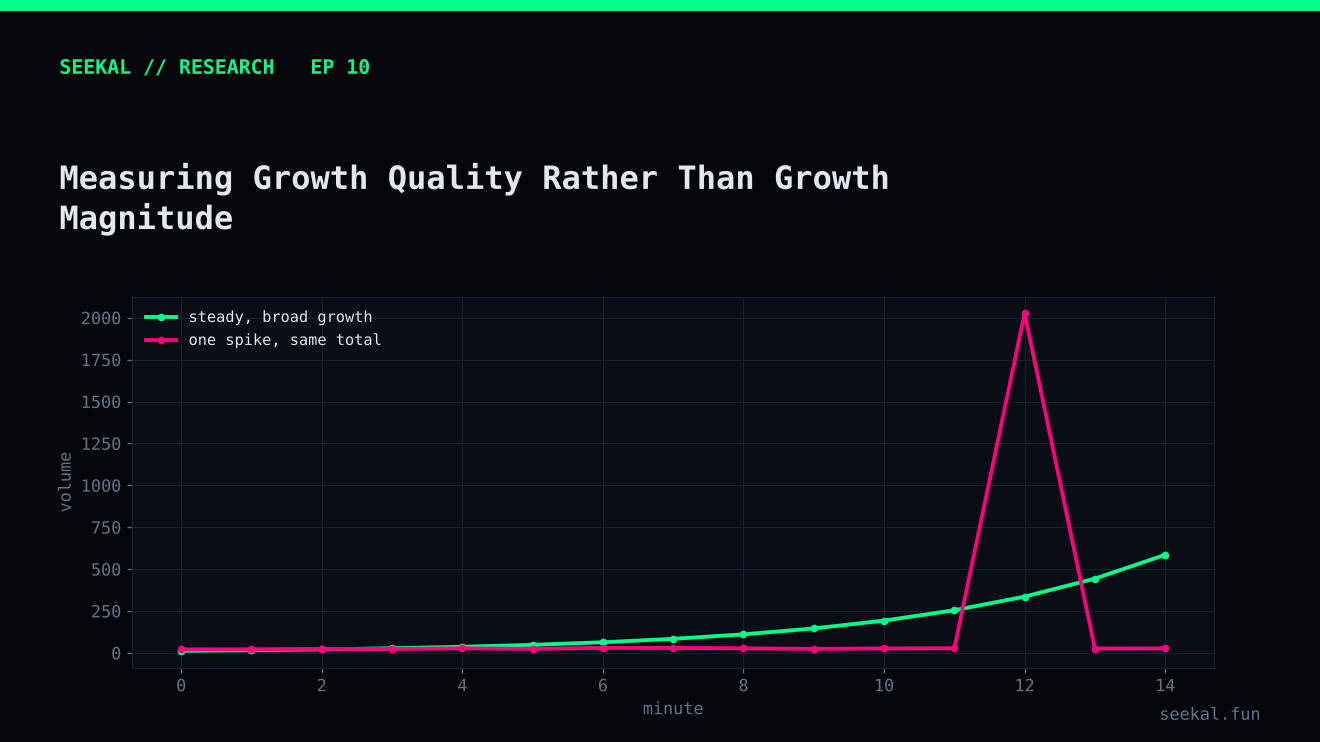
Growth magnitude asks how large an increase was. Growth quality asks what kind of activity produced it. In a fast-moving dataset, an impressive number can hide a weak foundation: a tiny starting volume, concentrated participation, thin liquidity or activity that quickly fades.
The aim is not to declare that one pattern is always good. It is to measure more of the behaviour behind the headline growth figure.
Magnitude is only one dimension
Suppose two launches show the same ten-minute cumulative growth ratio. One began with meaningful volume and added activity across a broad group of buyers. The other began with almost no volume and then recorded a small number of large trades. The ratio alone cannot distinguish these patterns.
A more complete view separates several dimensions:
- Scale: how much volume or liquidity exists in absolute terms?
- Acceleration: how much additional volume arrived during the later interval?
- Participation: how many distinct buyer wallets were observed?
- Distribution: how concentrated was activity among the largest wallets?
- Persistence: did activity continue across successive windows?
- Selling pressure: how much early buying was followed by selling?
- Data quality: are the measurements complete and correctly timed?
These dimensions can complement one another, but they are not perfect measures of intent. Unique wallets do not prove unique people, and a clean-trade filter is only as good as its assumptions.
Build a growth-quality profile
Rather than creating one opaque score immediately, start with a profile. Show vol_5, vol_10, incremental volume from minute five to ten and growth_10. Add liquidity at relevant checkpoints and the change in liquidity. Then add unique buyers, repeat-buyer share, top-buyer concentration, top-ten concentration and early-selling measures.
The profile lets a researcher see whether a high growth ratio is supported by absolute scale and broader participation. It also makes conflicting evidence visible. For example, a launch may have strong incremental volume but concentrated buying. That is not a contradiction to hide; it is a mixed pattern to investigate.
What exploratory buckets can and cannot tell you
Quantile analysis is a useful first step. Divide a feature into groups of roughly equal size and calculate the GOOD rate in each group. If the rate rises steadily across quartiles, the relationship may be monotonic. If it rises and then falls, the relationship may be nonlinear. If it barely changes, the feature may add little by itself.
In the BSC exploration, quartile tables for buyer participation, repeat-buyer behaviour and other quality measures showed patterns that were not consistently monotonic. Some middle buckets had higher GOOD rates than the highest bucket. The exact percentages changed across analysis runs when bucket construction changed, so those tables should be treated as exploratory diagnostics rather than stable effect estimates.
This is precisely why a feature should not be labelled “good” or “bad” because one quartile performed best. Check the sample counts, use a consistent quantile method, repeat the analysis across time periods and validate any threshold on data not used to choose it.
Avoid turning proxies into certainty
Buyer counts, concentration ratios and wallet-level patterns are proxies. A high number of wallets could reflect broad participation, but could also include related wallets. A low repeat-buyer percentage may indicate wider participation, but it could also reflect measurement boundaries. A clean-volume measure can exclude small trades or known service wallets, but such rules are imperfect.
The purpose of combining these signals is not to claim that the dataset reveals every participant's motive. It is to reduce dependence on one headline metric and test whether several independent dimensions improve the model's decisions.
From profile to model
Once the profile is understood, build a baseline model and add feature groups one at a time: volume structure, liquidity, participation, concentration and selling pressure. Use chronological validation to check whether each group adds useful information. Examine whether the improvement persists across folds and whether it changes the selected candidate count.
A useful model should be able to say more than “growth was high.” It should be evaluated on whether its combined feature representation separates outcomes more reliably on later observations.
Build a profile before compressing it into a score
A composite “quality score” can hide trade-offs and make it difficult to diagnose failures. Keep the original dimensions visible first. Once there is evidence that several measures contribute consistently, test a combined model or carefully defined index. Document the normalisation, weights and missing-value treatment, and test whether the index adds value beyond its components. The profile should make the evidence clearer, not turn a set of uncertain proxies into a false impression of certainty.
The practical lesson
Growth magnitude describes how much. Growth quality investigates how it happened. Retain absolute and incremental measurements, inspect participation and liquidity, treat wallet metrics as imperfect proxies and validate every proposed combination out of time. The goal is not a prettier growth score; it is a more defensible understanding of the activity behind it.