
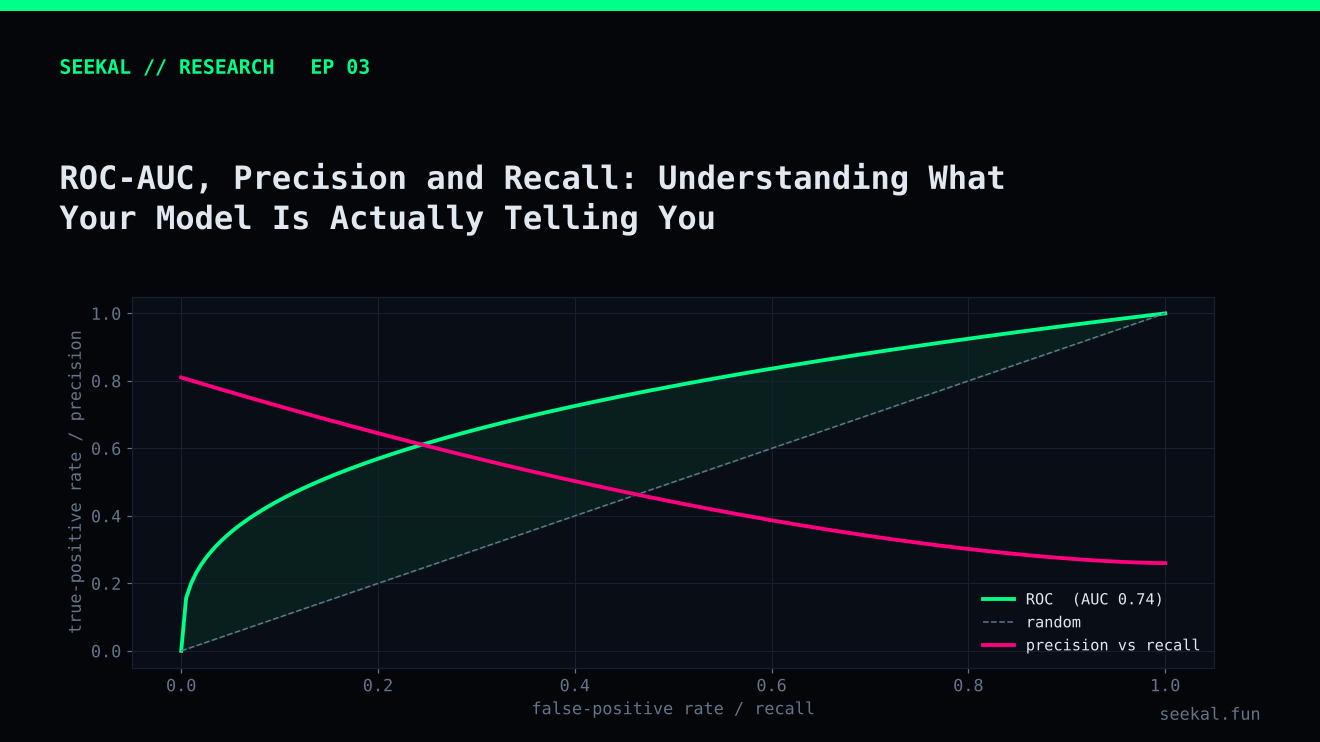
Model evaluation can become confusing when several metrics move in different directions. A classifier may have a respectable ROC-AUC but disappoint when converted into a list of selected candidates. Another model may have a similar area under the precision-recall curve but behave differently at the threshold that matters.
The solution is not to search for one magic metric. It is to understand what each metric measures and connect it to the decision the model is intended to support.
Precision: how many selected cases were positive?
Precision answers: among all observations the model predicted as positive, what fraction were truly positive?
If a model selects 40 candidates and 20 meet the positive label, precision is 50%. The other 20 are false positives. Precision is useful when every selected candidate requires attention or when false positives are costly.
But precision alone is incomplete. A model that selects only one highly confident case and gets it right has 100% precision, yet it may miss almost every positive opportunity in the dataset.
Recall: how many positive cases did the model find?
Recall answers: among all truly positive observations, what fraction did the model identify?
A model with high recall catches more positive cases, but it may also select many false positives. Precision and recall usually trade off as the threshold changes.
For a candidate-screening system, the right balance depends on how the candidate list will be used. A small research team might prefer a shorter, more precise list. A broad discovery process may accept lower precision to avoid missing too many positive labels. The metric must follow the use case.
ROC-AUC: how well does the model rank?
The receiver operating characteristic curve plots true-positive rate against false-positive rate across thresholds. ROC-AUC summarises the curve. Informally, it measures how often a randomly chosen positive receives a higher score than a randomly chosen negative.
ROC-AUC is useful for comparing ranking ability across thresholds. However, it does not tell you what precision will be at one chosen threshold. It can also look more reassuring when the negative class is much larger than the positive class, because the false-positive rate is calculated relative to all negatives.
Precision-recall AUC: focus on the positive class
The precision-recall curve plots precision against recall as the threshold changes. Average precision or PR-AUC-style summaries are often more informative when positives are relatively uncommon and the quality of positive selections is central.
The baseline for a random ranking is related to the positive-class prevalence. In the BSC dataset, approximately 25.6% of the labelled observations were GOOD. That prevalence provides useful context for interpreting a precision-recall score, although the relevant baseline in a Stage 2 candidate pool will be its own GOOD rate, not the full-dataset rate.
Be precise about the implementation. “PR-AUC” and “average precision” are sometimes used interchangeably in informal reporting, but different libraries may calculate area or interpolation differently. Record the exact metric and implementation.
A real example of metrics disagreeing
In one Stage 2 evaluation on a chronological holdout of 112 candidates, regularised logistic regression achieved ROC-AUC 0.6242 and PR-AUC 0.4674. The LightGBM version achieved ROC-AUC 0.5890 and PR-AUC 0.4705. At a probability threshold of 0.50, logistic regression selected 46 candidates, with 22 GOOD and 24 BAD: precision 47.83% and recall 56.41%. LightGBM also selected 46, but with 17 GOOD and 29 BAD: precision 36.96% and recall 43.59%.
The metrics do not name a universal winner. Logistic regression had the stronger ROC-AUC and selected-set precision in this holdout, while LightGBM's PR-AUC was marginally higher. The difference in PR-AUC was very small, and the holdout was modest in size. Cross-validation summaries were mixed too. The correct conclusion is that the evidence is inconclusive, not that one algorithm has been proven superior.
Report metrics in layers
A useful evaluation report includes ranking metrics (ROC-AUC and average precision), threshold metrics (precision, recall, false-positive count and selected count), class prevalence, sample size and time period. Include the confusion matrix. If probabilities are used as probabilities, inspect calibration: a group of predictions near 0.70 should be positive about 70% of the time over a sufficiently large, representative sample.
Finally, connect the label to the real objective. A model can predict a peak-price label and still fail to produce an executable outcome after costs and constraints. A profitable decision process needs separate measurements of realised outcomes, not just classification metrics.
Add calibration and workload to the scorecard
A useful scorecard should also show calibration and operational volume. Calibration asks whether predicted probabilities correspond to observed frequencies over sufficiently large groups. Workload asks how many observations cross the threshold and therefore require review. A model can have good ranking metrics but poor probability calibration, or high recall at a volume that no downstream process can handle. Plot reliability by score bucket, show the selected count and use the same evaluation population when comparing models.
The practical lesson
Use ROC-AUC to understand broad ranking behaviour, precision-recall analysis to understand positive-class retrieval, and threshold metrics to understand the actual selected list. None replaces the others. Choose a metric because it answers a specific question, then publish the sample size and limitations beside it.