
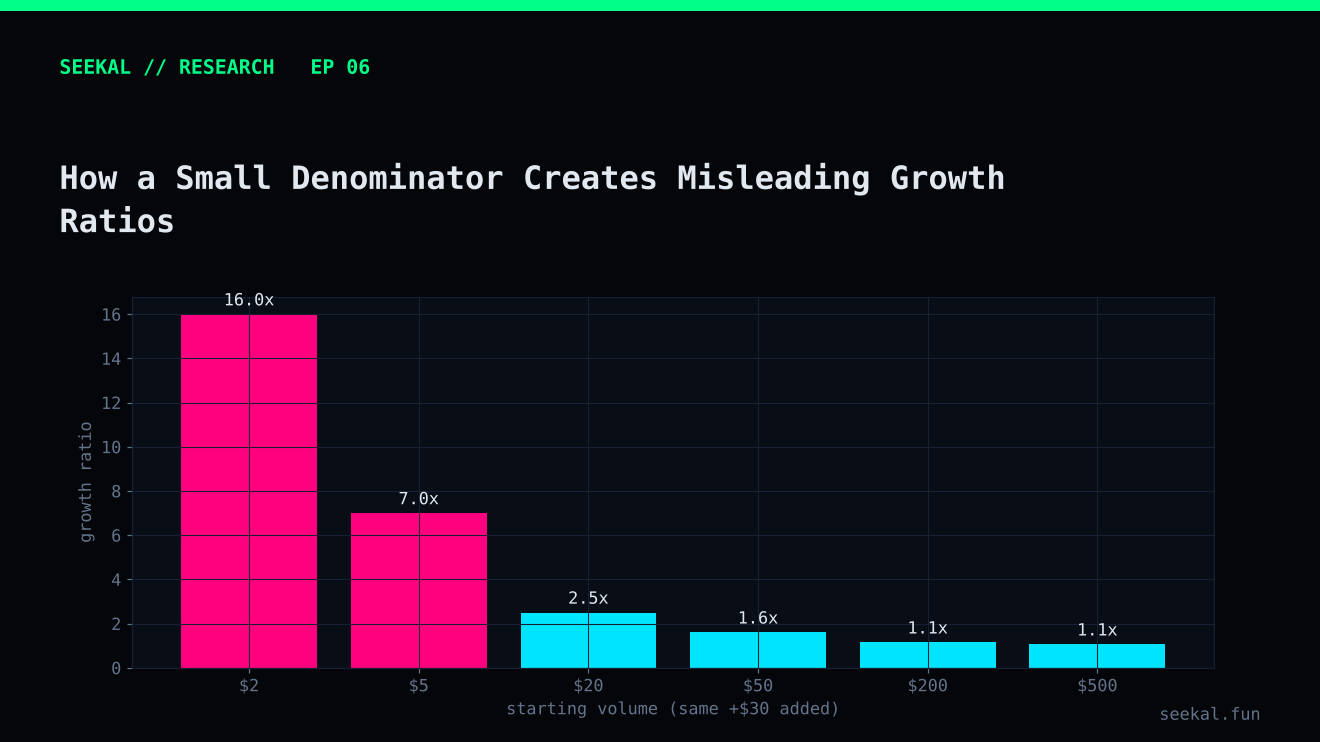
Ratios are attractive features because they compress two measurements into one number. A growth ratio can describe how much activity increased relative to an earlier baseline. But the ratio can become misleading when that baseline is extremely small.
This is not merely a statistical technicality. It changes what the number means. A ratio of 20,000 may look like extraordinary growth, even when the underlying activity is modest because the starting value was close to zero.
The arithmetic behind the problem
In the BSC research pipeline, growth_10 was defined as cumulative quote volume during the first ten minutes divided by cumulative quote volume during the first five minutes:
Because vol_10 includes the first five minutes, it can also be rewritten as:
This second form makes the denominator problem obvious. Suppose the first five-minute volume is $1 and the next five minutes add $20. The cumulative ratio is 21. Now suppose the first five-minute volume is $0.01 and the next five minutes add the same $20. The ratio becomes 2,001. The additional volume is identical, but the ratio differs dramatically because the starting baseline changed.
The second observation is not necessarily wrong. It is simply not comparable to the first without considering the absolute volumes.
A case worth investigating
During the BSC feature review, a token had a reported growth_10 value of 20,975.2. The early trade history also showed a trade under one dollar within the first nine minutes. That combination suggests a potentially tiny early baseline, but the precise vol_5 must be retrieved from the source calculations before attributing the value to a specific denominator.
The correct process is to inspect the exact five-minute volume, ten-minute volume, incremental five-to-ten-minute volume and underlying trades. Confirm the time boundaries, units and rounding. A high ratio may be mathematically correct and still be a poor standalone description of activity.
Use the numerator and denominator together
A safer feature set can retain several views rather than depending on one ratio:
- Absolute baseline volume, such as
vol_5. - Absolute cumulative volume, such as
vol_10. - Incremental volume from minute five to minute ten.
- The ratio itself, where it remains meaningful.
This gives a model the context needed to distinguish “large percentage increase from almost nothing” from “large increase on top of an already meaningful base.” The model may learn that a ratio is informative only when the denominator is above a certain range, but that relationship must be validated rather than assumed.
Denominator floors and transformations
One option is to define a minimum denominator. For example, a ratio might only be considered valid when vol_5 exceeds a pre-defined floor. This can prevent unstable values, but the floor should have a defensible meaning in the measurement units. It should not be chosen solely because it improves one holdout result.
Another option is a smoothed ratio:
where the constants are chosen with care. Smoothing changes the feature definition and can compress meaningful differences, so it needs a clear rationale and out-of-time testing. A log transformation can reduce right-skew, but it does not automatically fix the underlying interpretability problem.
You can also model absolute incremental volume and baseline volume separately, then test whether an interaction between them adds value.
Avoid the opposite mistake
Do not discard every high-growth observation. Some may represent genuine acceleration. The goal is to separate robust acceleration from arithmetic amplification. Check the raw observations, compare the numerator and denominator distributions by label and inspect whether the ratio's apparent predictive power depends on a handful of tiny-baseline rows.
In the project review, the most useful next step was not to change the model immediately. It was to audit the upper tail of growth_10, inspect the relevant raw volume windows and compare GOOD and BAD distributions. That makes the decision evidence-led.
Test whether the ratio depends on a few observations
Compare model performance with and without the most extreme ratio observations, but treat this as a sensitivity analysis rather than permission to delete inconvenient rows. Also create denominator bands and inspect the relationship between growth_10 and the label inside each band. If the ratio only appears predictive when vol_5 is extremely small, its value may be driven by arithmetic instability. Any denominator rule should be defined from measurement logic and assessed on later data, not selected to maximise one historical metric.
The practical lesson
A ratio is a relationship between two quantities, not a complete description of either one. Whenever a growth feature becomes extreme, ask what happened to the denominator. Preserve absolute values and incremental measures alongside the ratio, document any denominator floor and test the definition on later chronological data. A large ratio should invite investigation, not automatic confidence.