
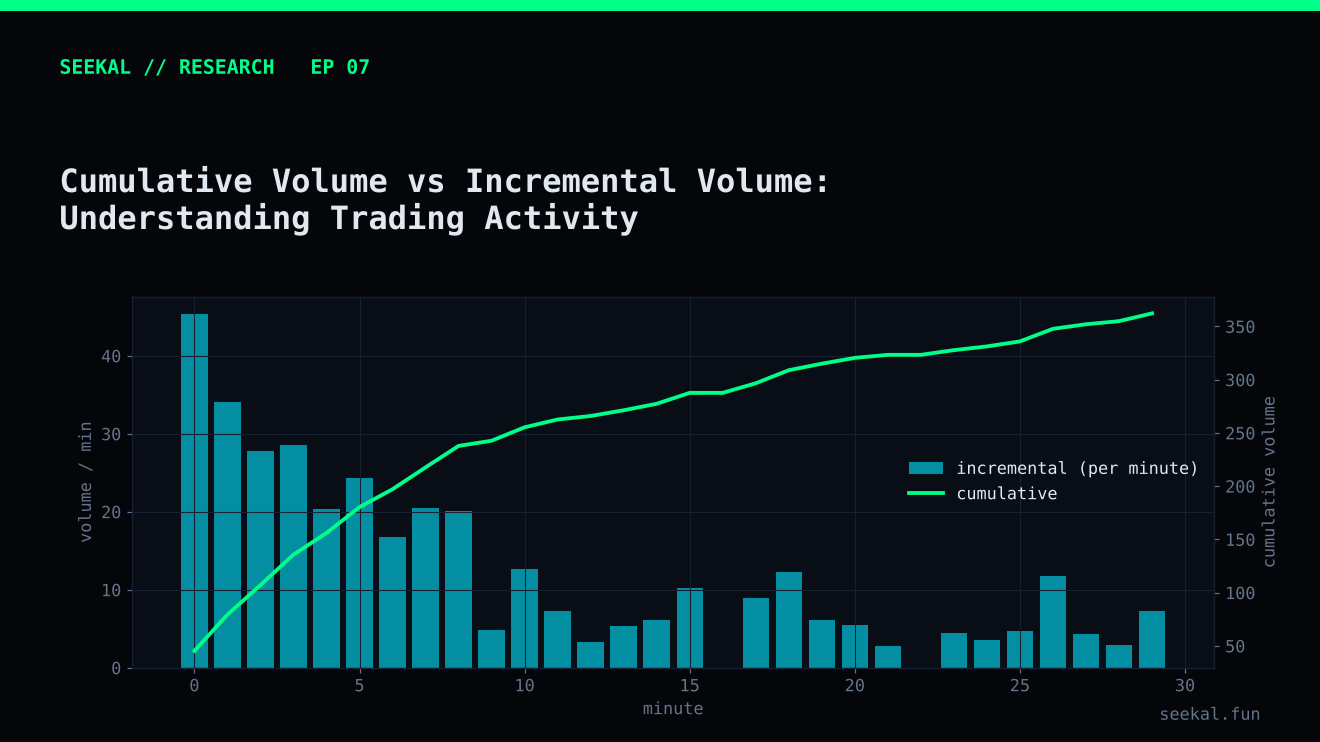
Two features can sound as though they measure the same thing while describing different behaviour. Cumulative volume tells us how much activity has occurred since the beginning of a window. Incremental volume tells us how much activity occurred during one segment of that window.
Both can matter. Confusing them can lead to repeated information, misleading growth ratios and an incomplete picture of how activity developed.
What cumulative volume tells you
Suppose a token has quote volume of $100 during the first five minutes and $60 more between minutes five and ten. Its cumulative volume at minute ten is $160.
Cumulative volume is useful because it measures total recorded activity over a defined period. It is often easier to compare across tokens and windows, provided the same time boundaries and currency units are used.
But cumulative volume hides the path. A total of $160 could mean $150 in the first five minutes and $10 in the next five, or $20 in the first five and $140 in the next five. Both produce the same cumulative total, but the activity pattern is very different.
What incremental volume tells you
Incremental volume isolates the activity within a segment. In the example above, the five-to-ten-minute incremental volume is $60:
It answers a different question: how much additional activity arrived after the initial window?
This can help distinguish a launch that begins with concentrated early activity and then fades from one that builds activity over time. It still does not prove that demand is organic, broad or persistent. Incremental volume should be examined alongside trade size, buyer participation, liquidity and other quality measures.
Why the ratio needs context
The BSC pipeline's growth_10 feature is cumulative vol_10 divided by cumulative vol_5. It is not simply the amount of new volume between minutes five and ten. It equals one plus incremental volume divided by the initial five-minute volume.
That distinction matters. A high ratio could reflect a strong second interval, a very small first interval, or both. Therefore, the ratio is best interpreted with vol_5 and the incremental five-to-ten-minute amount visible beside it.
A practical feature table might contain vol_5, vol_10, incremental_vol_5_10 and growth_10. The first three describe scale and timing. The fourth expresses relative change. Whether all four improve a model is an empirical question; correlated features may add little or make interpretation harder.
Compare patterns, not just totals
For each observation, compare the early and later segments. Ask whether activity is accelerating, slowing or remaining steady. Then compare those patterns between GOOD and BAD labels. Use medians and percentiles because volume data is often skewed. Do not rely only on averages, which can be dominated by a few very large observations.
Consider dividing incremental volume by the number of minutes in the segment if windows have different lengths. Keep windows consistent wherever possible. If one feature covers five minutes and another covers fifteen, raw totals are not directly comparable without accounting for duration.
Volume is not participation
A small number of large trades can generate high volume. Many small trades can produce similar volume. Neither pattern is automatically better. Add buyer counts, repeat-buyer measures, concentration and trade-size distributions to understand how the activity is distributed.
Even then, wallet-level counts are not the same as independent human participants. Wallets can be controlled by related parties, and one actor can use multiple addresses. Treat these fields as observable proxies, not proof of identity or intent.
Make window boundaries explicit
A feature specification should state whether a window includes its starting or ending minute, how late-arriving events are handled and whether timestamps are measured from launch time or first observed trade. Two implementations can both be called “ten-minute volume” while using different boundaries. Validate calculations with a few hand-checked examples from raw trades. Consistent definitions matter more than adding many time windows whose boundaries are not reproducible.
The practical lesson
Cumulative volume tells you how much has happened so far. Incremental volume tells you what arrived during a specific interval. Growth ratios put the two into a relative relationship, but can become unstable when the baseline is tiny. Keep the measures conceptually separate, inspect their distributions and test whether each contributes information beyond the others.